Engulfing Pro v1Engulfing Pro v1 — Pro Inside (C2-in-wick) signals
Engulfing Pro v1 finds a precise three-bar sequence designed to catch clean continuations or turns after an impulsive move. The signal—called Pro Inside—fires when price closes back inside the wick of a prior engulfing bar, often indicating a controlled pullback into freshly swept liquidity.
What it detects
Engulfing pre-condition (Bars -2 → -1):
A strict bullish or bearish body engulfing occurs one bar before the signal (larger body, full body containment).
Pro Inside signal (Bar 0 / C2):
The current bar (C2) closes inside the wick of the engulfing bar (C1):
Bullish: C2 closes inside C1’s upper wick
Bearish: C2 closes inside C1’s lower wick
Optional C3 confirmation (info only):
The next bar closes beyond C2’s extreme (above for bullish, below for bearish).
Why it matters
The “close-inside-wick” structure frequently marks a measured pullback after momentum just flipped (engulfing), offering a clear, rules-based entry with defined invalidation.
Inputs
Show Pro Inside (Bullish) — toggle bullish signals
Show Pro Inside (Bearish) — toggle bearish signals
Change bar color on signal (C2) — color C2 (lime/red)
Plot markers — C2 triangles and ✔ on C3 confirmations
Boundary padding (ticks) — nudge wick bounds to reduce marginal touches
Visuals & Alerts
Markers:
“C2” triangle up/down on qualifying bars
“✔” circle on C3 confirmations
Alert names:
Pro Inside (Bullish)
Pro Inside (Bearish)
Pro Inside — Bullish C3 confirmation
Pro Inside — Bearish C3 confirmation
How to use (ideas, not advice)
Entry: Aggressive at/after C2 close; conservative on C3 confirmation.
Stops: Common placements beyond the opposite side of C2, or beyond C1’s wick.
Confluence: Pair with market structure, higher-timeframe bias, or Supply & Demand zones for selectivity.
Timeframes/markets: Works on any symbol/TF; adapt padding for volatility.
Notes
Evaluates on bar close (no look-ahead).
Visual/alert tool for study and workflow—not financial advice.
Always forward-test and risk-manage appropriately.
Search in scripts for "Up down"

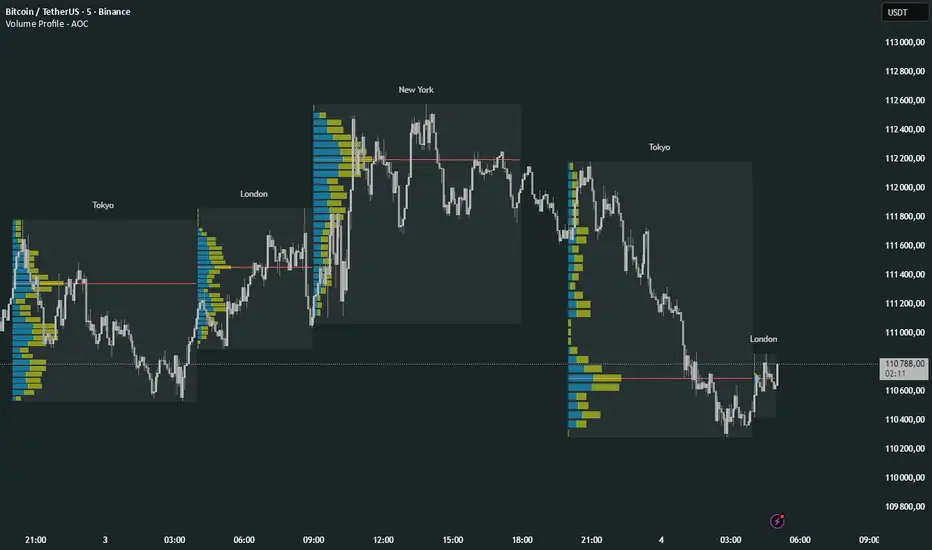
Volume Profile Multi periodVolume Profile - AOC 📈
Unlock market insights with this powerful volume profile indicator! Analyze trading activity across multiple sessions with customizable settings and clear visuals. Perfect for traders aiming to identify key price levels and market trends with precision. 🚀
Key Features:
Multi-Session Support: Visualize volume profiles for Tokyo, London, New York, Daily, Weekly, Monthly, Quarterly, and Semiannual sessions. 🌍
Customizable Display: Choose session types, resolution, and bar modes (Mode 1 or Mode 2) to match your strategy. 🎛️
Point of Control (POC): Highlights the most traded price levels for each session. 🎯
Color-Coded Profiles: Distinct up/down volume visualization for quick analysis. 📊
Session Labels: Optional labels for easy identification of session periods. 🏷️
High/Low Tracking: Tracks session-specific highs and lows for accurate profiling. 📏
Empower your trading decisions with clear, actionable volume data! 💡
RSI Crossover AlertRSI Crossover Alert Indicator - User Guide
The RSI Crossover Alert Indicator is a comprehensive technical analysis tool that detects multiple types of RSI crossovers and generates real-time alerts. It combines traditional RSI analysis with signal lines, divergence detection, and multi-level crossing alerts.
1. Multiple Crossover Detection
- RSI/Signal Line Cross: Signals a primary trend change.
- RSI/Second Signal Cross: Confirmation signals for stronger trends.
- Level Crossings: Crosses of Overbought 70, Oversold 30, and Midline 50.
- Divergence Detection: Hidden and regular divergences for reversal signals.
2. Alert Types
- Alert: RSI > Signal
Description: Bullish momentum is building.
Signal: Consider long positions.
- Alert: RSI < Signal
Description: Bearish momentum is building.
Signal: Consider short positions.
- Alert: RSI > 70
Description: Entering the overbought zone.
Signal: Prepare for a potential reversal.
- Alert: RSI < 30
Description: Entering the oversold zone.
Signal: Watch for a bounce opportunity.
- Alert: RSI crosses 50
Description: A shift in momentum.
Signal: Trend confirmation.
3. Visual Components
- Lines: RSI blue, Signal orange, Second Signal purple
- Histogram: Visualizes momentum by showing the difference between RSI and the Signal line.
- Background Zones: Red overbought, Green oversold
- Markers: Up/down triangles to indicate crossovers.
- Info Table: Real-time RSI values and status.
Strategy 1: Classic Crossover
- Entry Long: RSI crosses above the Signal Line AND RSI is below 50.
- Entry Short: RSI crosses below the Signal Line AND RSI is above 50.
- Take Profit: On the opposite signal.
- Stop Loss: At the recent swing high/low.
Strategy 2: Extreme Zone Reversal
- Entry Long: RSI is below 30 and crosses above the Signal Line.
- Entry Short: RSI is above 70 and crosses below the Signal Line.
- Risk Management: Higher win rate but fewer signals. Use a minimum 2:1 risk-reward ratio.
Strategy 3: Divergence Trading
- Setup: Enable divergence alerts and look for price/RSI divergence. Wait for an RSI crossover for confirmation.
- Entry: Enter on the crossover after the divergence appears. Place the stop loss beyond the starting point of the divergence.
Strategy 4: Multi-Timeframe Confirmation
1. Check the higher timeframe e.g. Daily to identify the main trend.
2. Use the current timeframe e.g. 4H/1H for your entry.
3. Only enter in the direction of the main trend.
4. Use the RSI crossover as the entry trigger.
Optimal Settings by Market
- Forex Major Pairs
RSI Length: 14, Signal Length: 9, Overbought/Oversold: 70/30
- Crypto High Volatility
RSI Length: 10-12, Signal Length: 6-8, Overbought/Oversold: 75/25
- Stocks Trending
RSI Length: 14-21, Signal Length: 9-12, Overbought/Oversold: 70/30
- Commodities
RSI Length: 14, Signal Length: 9, Overbought/Oversold: 80/20
Risk Management Rules
1. Position Sizing: Never risk more than 1-2% on a single trade. Reduce size in ranging markets.
2. Stop Loss Placement: Place stops beyond the recent swing high/low for crossovers. Using an ATR-based stop is also effective.
3. Profit Taking: Take partial profits at a 1:1 risk-reward ratio. Switch to a trailing stop after reaching 2:1.
1. Filtering Signals
- Combine with volume indicators.
- Confirm the trend on a higher timeframe.
- Wait for candlestick pattern confirmation.
2. Avoid Common Mistakes
- Don't trade every single crossover.
- Avoid taking signals against a strong trend.
- Do not ignore risk management.
3. Market Conditions
- Trending Market: Focus on midline 50 crosses.
- Ranging Market: Look for reversals from overbought/oversold levels.
- Volatile Market: Widen the overbought/oversold levels.
- If you get too many false signals:
Increase the signal line period, add other confirmation indicators, or use a higher timeframe.
- If you are missing major moves:
Decrease the RSI length, shorten the signal line period, or check your alert settings.
Recommended Combinations
1. RSI + MACD: For dual momentum confirmation.
2. RSI + Bollinger Bands: For volatility-adjusted signals.
3. RSI + Volume: To confirm the strength of a signal.
4. RSI + Moving Averages: To use as a trend filter.
This indicator provides a comprehensive RSI analysis. Success depends on proper configuration, risk management, and combining signals with the overall market context. Start with the default settings, then optimize based on your trading style and market conditions.

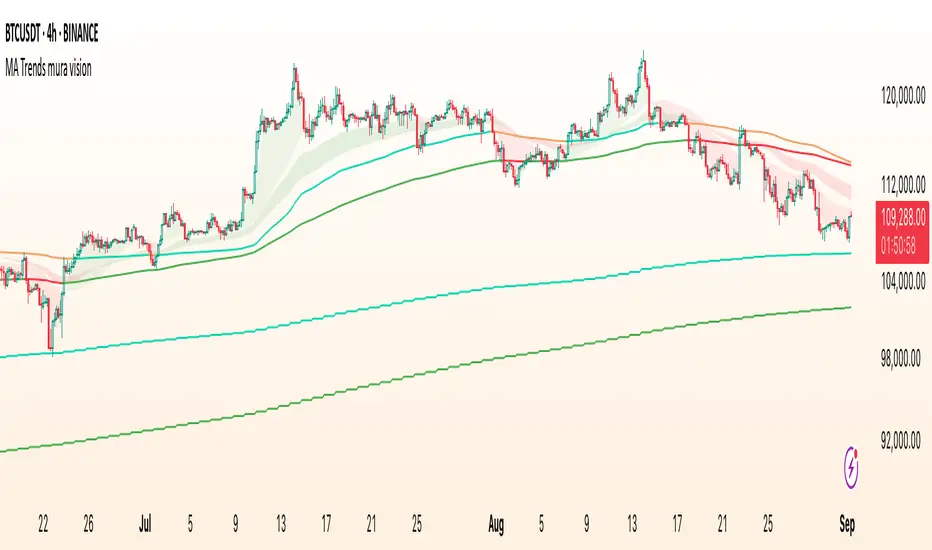
MA Trends — mura visionMA Trends — mura vision is a multi-timeframe trend map that blends two local trend “ribbons” on the current timeframe with higher-timeframe context lines. It helps you read market bias at a glance and align entries with the dominant trend.
What the indicator plots
On the current timeframe
SMA 5/34 — short-term trend ribbon (filled area between SMA5 and SMA34).
EMA 55/89 — swing trend ribbon (filled area between EMA55 and EMA89).
Higher-timeframe context
EMA 233 (4H & 1D) — plotted as lines. Color reflects whether price on the same HTF is above (support) or below (resistance).
KAMA 233 (4H & 1D) — plotted as lines using a custom Kaufman implementation (Efficiency Ratio with fast=2, slow=30; squared smoothing). Color logic is the same as EMA 233.
Optional (disabled by default)
EMA 233 & KAMA 233 on the current TF — toggle on if you want the same 233 anchors on the chart’s timeframe.
Note: All higher-TF series are requested via request.security() with lookahead_off .
How to read it
1 Bias : Use the 4H/1D EMA/KAMA 233 as dynamic anchors.
• Green = price is above the anchor on that HTF (supportive context).
• Red = price is below the anchor on that HTF (resistive context).
2 Alignment : When both ribbons are green (SMA5>34 and EMA55>89) while HTF anchors are green, momentum and context agree (higher-quality trend). The opposite coloring suggests bearish alignment.
3 Pullbacks : Retracements toward the ribbon edges often act as retest zones within the prevailing regime.
Inputs & customization
Visibility toggles for each block:
SMA 5/34 (current TF), EMA 55/89 (current TF), EMA/KAMA 233 for 4H, 1D, and current TF (the latter are off by default).
Colors :
Lines for SMA5/SMA34 and EMA55/EMA89 (plotted with high transparency), fill colors for up/down trend ribbons, and separate support/resistance colors for EMA/KAMA 233.
Line width for all 233 anchors.
MTF behavior & repainting notes
HTF lines (4H/1D) are computed with lookahead_off and update intrabar until the higher-TF candle closes. This is expected on TradingView and not “future-looking”, but values can stabilize only at the close of the 4H/1D bar.
If you require strictly confirmed HTF values, use a “previous bar” approach (e.g., plotting series ) — not included here to keep the display responsive.
Good practices
Determine direction with 4H/1D EMA/KAMA 233, then refine timing with the current-TF ribbons.
For conservative use, favor trades with the color of the dominant HTF anchor.
Combine with your own risk management and confirmation rules.
What this script is / isn’t
✅ Visual analysis tool for multi-timeframe trend context.
❌ Not a strategy: it does not generate orders or calculate P&L.
Credits & license
© trading_mura — Published for educational purposes under the Mozilla Public License 2.0.
KAMA is implemented via a custom Kaufman method (ER with fast=2, slow=30, squared smoothing), not ta.kama() .
Disclaimer
Trading involves risk. This indicator is provided “as is” for informational/educational use only and is not financial advice. Always test on historical data and use proper risk management.
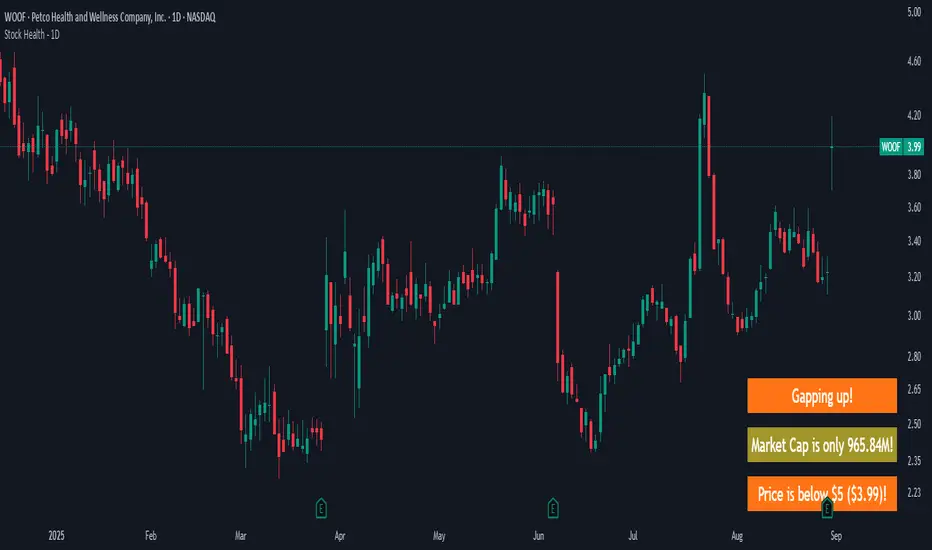
Stock Health - 1DWarns you if you look at a "bad" stock, meaning:
Market cap is < 1B (and more intrusive warning if < 500M)
Price is < 10$ (more intrusive if < 5$)
Yesterday's Daily Volume was < 1M (more instrusive if < 500K)
There are earnings end of the day / tomorrow morning
There's a Gap up/down - because I likely shouldn't jump in already but see how it develops
Meant to be used on a 1D chart.
More infos: www.reddit.com
AlgoFlex Buy Sell Signal (1h only)
**Overview**
AlgoFlex Scalper plots buy/sell signal markers using:
* a range filter (EMA of absolute bar changes) to define short-term bias,
* an Adaptive Moving Average (AMA) slope to confirm direction, and
* an ATR threshold to filter weak momentum.
Signals are evaluated on bar close to reduce intrabar noise. This is an indicator, not a strategy.
**How it works (concepts)**
* Range filter: smooths price with an EMA-based range measure and forms upper/lower bands.
* Trend state: counts consecutive movements of the filtered series (up/down counters) to avoid whipsaws.
* AMA + ATR gate: rising AMA with change > ATR \* atrMult can produce a long signal; falling AMA with change < -ATR \* atrMult can produce a short signal.
* TP/SL markers: projected using ATR multiples (tpMult, slMult). Visual guides only.
* Buy Signal, Sell Signal, plus optional TP/SL notifications. Designed to fire on bar close.

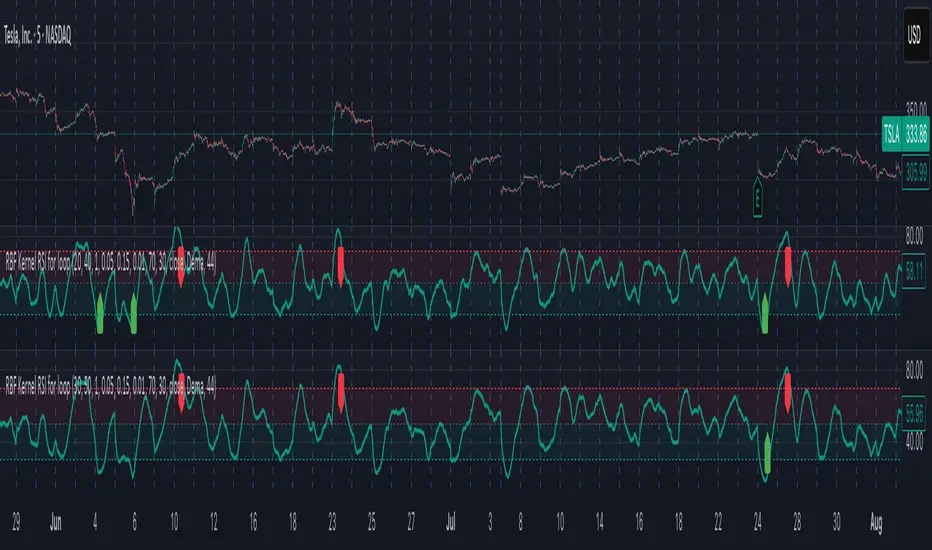
Radial Basis Kernel RSI for LoopRadial Basis Kernel RSI for Loop
What it is
An RSI-style oscillator that uses a radial basis function (RBF) kernel to compute a similarity-weighted average of gains and losses across many lookback lengths and kernel widths (γ). By averaging dozens of RSI estimates—each built with different parameters—it aims to deliver a smoother, more robust momentum signal that adapts to changing market conditions.
How it works
The script measures up/down price changes from your chosen Source (default: close).
For each combination of RSI length and Gamma (γ) in your ranges, it builds an RSI where recent bars that look most similar (by price behavior) get more weight via an RBF kernel.
It averages all those RSIs into a single value, then smooths it with your selected Moving Average type (SMA, EMA, WMA, HMA, DEMA) and a light regression-based filter for stability.
Inputs you can tune
Min/Max RSI Kernel Length & Step: Range of RSI lookbacks to include in the ensemble (e.g., 20→40 by 1) or (e.g., 30→50 by 1).
Min/Max Gamma & Step: Controls the RBF “width.” Lower γ = broader similarity (smoother); higher γ = more selective (snappier).
Source: Price series to analyze.
Overbought / Oversold levels: Defaults 70 / 30, with a midline at 50. Shaded regions help visualize extremes.
MA Type & Period (Confluence): Final smoothing on the averaged RSI line (e.g., DEMA(44) by default).
Red “OB” labels when the line crosses down from extreme highs (~80) → potential overbought fade/exit areas.
Green “OS” labels when the line crosses up from extreme lows (~20) → potential oversold bounce/entry areas.
How to use it
Treat it like RSI, but expect fewer whipsaws thanks to the ensemble and kernel weighting.
Common approaches:
Look for crosses back inside the bands (e.g., down from >70 or up from <30).
Use the 50 midline for directional bias (above = bullish momentum tilt; below = bearish).
Combine with trend filters (e.g., your chart MA) for higher-probability signals.
Performance note: This is really heavy and depending on how much time your subscription allows you could experience this timing out. Increasing the step size is the easiest way to reduce the load time.
Works on any symbol or timeframe. Like any oscillator, best used alongside price action and risk management rather than in isolation.
Balance & Reversal Indicator [SYNC & TRADE]ndicator Description: "Balance & Reversal Indicator "
Purpose of the Indicator
The "Balance & Reversal Indicator " indicator is designed for analyzing market activity in cryptocurrency and other financial markets. It assists traders in identifying potential trend reversal points, detecting market equilibrium zones, and evaluating the balance between buying and selling volumes. The indicator is suitable for both short-term and long-term trading, offering flexible settings to adapt to various trading styles and timeframes.
What Does the Indicator Provide?
Volume Analysis: Calculates buy and sell volumes, along with the Long/Short Ratio, to assess current market dynamics.
Reversal Signals: Generates signals for potential Long (buy) and Short (sell) reversals based on customizable levels, ranging from "Potential Reversal" to "Maximum Signal."
Equilibrium Zones: Identifies zones where the market is in balance, useful for recognizing neutral market conditions.
Flexible Calculation Methods: Supports four volume calculation methods (Tick Based, Candle Based, Delta Based, Price Movement) to suit different trading approaches.
Auto and Manual Sensitivity: Offers "Auto" mode for timeframe-based sensitivity or "Manual" mode for custom sensitivity settings.
Data Visualization: Displays key metrics (total volume, buy/sell volumes, ratio, and percentages) via a comparison table and on-chart labels for easy interpretation.
Volume Unit Customization: Allows volume display in USDT, Active contracts, or other units for enhanced flexibility.
How to Use the Indicator?
Adding to the Chart:
Find "Balance & Reversal Indicator " in the TradingView library and add it to your chart.
The indicator appears in a separate panel below the chart, keeping price data unobstructed (overlay=false).
Configuring Settings:
Calculation Method: Choose one of four volume analysis methods:
Tick Based: Analyzes price movement within a candle.
Candle Based: Evaluates candle direction (up/down).
Delta Based: Considers the difference between open and close prices.
Price Movement: Assesses movement strength based on candle body and wick sizes.
Sensitivity Mode:
In "Auto" mode, sensitivity adjusts automatically based on the timeframe (e.g., higher for minute charts, lower for daily charts).
In "Manual" mode, set sensitivity manually (from 0.1 to 1.0).
Reversal Levels (Long/Short): Configure levels for Long and Short signals with associated ranges. For example, Long Reversal Level 1 = -30% with a 5% range triggers signals between -35% and -30%.
Equilibrium Levels: Set levels for neutral market zones (e.g., ±7% for Equilibrium Level 1).
Messages: Customize signal messages to align with your trading style.
Analysis Period (Start/End Time): Define the time range for volume calculations.
Volume Unit: Select USDT, Active (active contracts), or Contracts for volume display.
Interpreting Signals:
Comparison Table (Top-Right Corner): Displays analysis results for all four calculation methods (Long/Short Ratio, Buy %, Sell %, Signal), enabling method comparison.
On-Chart Labels: Show total volume, buy/sell volumes, Long/Short Ratio, buy/sell percentages, current method, and sensitivity.
Color-Coded Signals:
Green: Potential Long (buy) opportunity.
Red: Potential Short (sell) opportunity.
Yellow: Market in equilibrium zone.
Chart Levels: Horizontal lines indicate reversal levels (green for Long, red for Short, yellow for equilibrium) with a transparency gradient for clarity.
Applying in Trading:
Use reversal signals to enter positions. For example, a "Maximum Long Signal" may indicate a strong buying opportunity.
Equilibrium zones help avoid trading during low-volatility periods.
Compare methods in the table to confirm signals.
Adjust settings to match your timeframe and asset. For instance, use "Tick Based" with high sensitivity for scalping on minute charts or "Price Movement" with low sensitivity for long-term trading.
Recommendations:
Test the indicator on historical data to optimize settings for your asset and strategy.
Combine indicator signals with other technical analysis tools (e.g., support/resistance levels or trend indicators) for greater accuracy.
Regularly update the time range (Start/End Time) to ensure relevant data analysis.
Who Is This Indicator For?
"Balance & Reversal Indicator " is ideal for traders who:
Trade on cryptocurrency exchanges and want to analyze trading volumes.
Seek reversal points for entering Long or Short positions.
Prefer customizable settings and the ability to compare different analysis methods.
Operate across various timeframes, from minutes to months.
Note: This indicator is not financial advice. Always conduct your own analysis and consider risks before making trading decisions.
© TradingStrategyCourses, 2025. All rights reserved.

Supertrend Trend Change Signals + Covered Points Only (v5)[NR]Supertrend with Buy/Sell Signals + Covered Points (v5)
Description
This indicator is a custom version of the Supertrend that provides:
Buy/Sell signals whenever the trend flips (Up → Buy, Down → Sell).
Covered points label at the end of each trend, showing the total price movement captured from entry to exit.
Optional colored candles based on trend direction.
Visual markers (triangle up/down) for quick identification of flips.
Built-in alert conditions for Buy and Sell flips.
Use case:
Designed for traders who want not only entry/exit alerts but also a quick view of how many points the previous run covered. Especially useful for index futures (e.g., NIFTY, BankNIFTY) or instruments where point movement matters.
⚠ Note: This is a study/indicator, not a strategy. It does not auto-trade and should be combined with your own analysis and risk management.

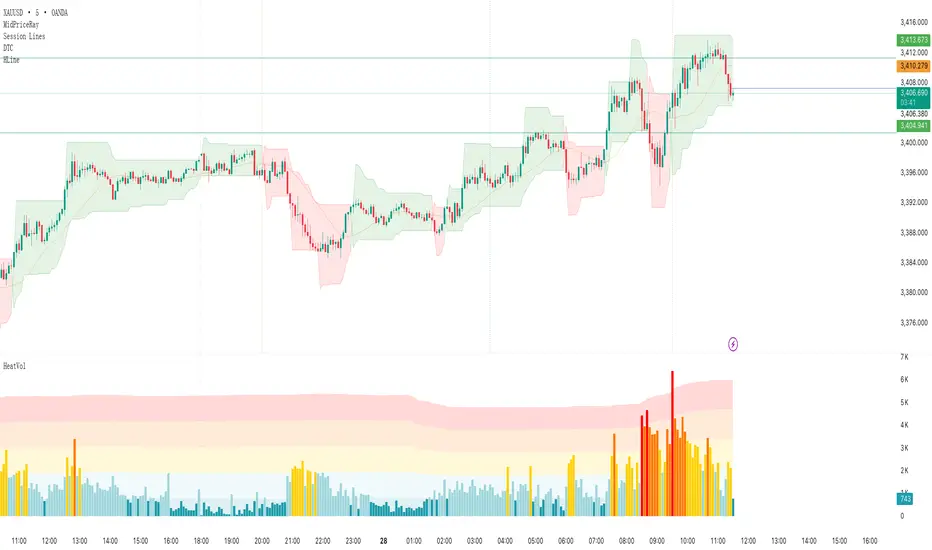
Heatmap Volume# Heatmap Volume (HeatVol) Indicator
A sophisticated volume analysis tool that visualizes trading volume intensity through a dynamic heatmap system. This indicator helps traders identify significant volume patterns and potential market turning points by comparing current volume to historical averages.
## Key Features
1. **Dynamic Volume Analysis**
- Moving average based volume comparison
- Standard deviation based threshold calculation
- Multiple volume intensity levels (Extra High, High, Medium, Normal, Low)
- Customizable lookback periods for both MA and Standard Deviation
2. **Visual Representation**
- Heatmap color coding for volume intensity
- Optional colored volume bars
- Multiple display modes (Lines, Backgrounds, Both, None)
- Two color schemes (Heatmap or Up/Down)
3. **Flexible Configuration**
- Adjustable threshold multipliers for each intensity level
- Customizable colors for all volume levels
- Separate color settings for bullish and bearish volumes
- Transparent overlays for clear price action visibility
4. **Alert System**
- Volume threshold breach notifications
- Direction-specific alerts (Up/Down)
- Multiple alert conditions for different volume levels
## Trading Applications
1. **Volume Analysis**
- Identify unusual volume spikes
- Detect volume divergences
- Monitor volume trend changes
- Spot potential accumulation/distribution
2. **Market Psychology**
- Gauge market participation levels
- Identify potential exhaustion points
- Confirm price movements with volume
3. **Trade Validation**
- Confirm breakouts with volume
- Validate trend strength
- Identify potential false moves
## Setup Guide
1. **Period Settings**
- Adjust MA length (default: 610) based on your timeframe
- Set Standard Deviation period for volatility sensitivity
- Fine-tune threshold multipliers for market conditions
2. **Visual Configuration**
- Choose between Heatmap or Up/Down color modes
- Select display style (Lines, Backgrounds, Both)
- Customize colors for different volume levels
## Best Practices
1. Use longer periods for trend analysis, shorter for day trading
2. Combine with price action for better trade decisions
3. Pay attention to color transitions for volume trend changes
4. Use alerts to catch significant volume events
## Notes
1. Higher threshold multipliers mean more selective volume signals
2. Color intensity reflects volume significance
3. Background mode provides better overall volume trend visibility
4. Line mode helps identify specific volume thresholds
This indicator is particularly useful for traders who rely on volume analysis for their trading decisions. It provides a clear visual representation of volume intensity and helps identify potentially significant market moves through volume analysis.
Volume Profile + VAH, VAL, and POCWhat it is
A clean, on-chart volume profile that approximates your visible range using a configurable Bars Back window. It builds a horizontal histogram of volume by price, splits each price bin into Buy vs Sell volume, draws POC, and computes Value Area High/Low (VAH/VAL). A Stealth Mode toggle switches to a subtle grayscale palette for low-key charts.
Why this instead of the built-in VPVR?
Buy/Sell split per bin: See which prices were defended by buyers vs sellers, not just total volume.
Value Area from POC outward: Classic expansion method until the selected % of total volume (default 70%).
Sleek borders & Stealth Mode: Crisp bin outlines and a one-click professional colorway.
Deterministic & fast: No sessions or anchors needed—set your Bars Back and go.
How it works (under the hood)
Window selection – Pine can’t read your viewport, so we approximate it with Bars Back (user input).
Binning – The window’s price range is divided into N bins.
Volume allocation – For each bar in the window:
Distribute Across Hi–Lo (optional): Spread volume across all bins the bar overlaps, weighted by overlap; or
Single-price mode: Assign all volume to one bin using a representative price (hlc3).
Buy/Sell split (two methods):
Body Proportional (recommended): Split by relative up/down body size (|close−open|).
Up/Down Candle: 100% buy if close ≥ open, else 100% sell.
POC & VA: Point of Control is the bin with max total volume. VAH/VAL expands from POC toward the higher-volume neighbor until the selected % of total volume is included.
Reading the visuals
Horizontal bars (right side): Total volume per price bin.
Left sub-segment = Sell volume
Right sub-segment = Buy volume
POC line: Price level with peak total volume.
VAH / VAL (dashed): Upper and lower bounds of the selected Value Area.
Borders: Each bin has a clean outer outline so the profile looks tight and organized.
Stealth Mode: Grayscale palette that preserves contrast without loud colors.
Key inputs (organized for clarity)
Theme
Stealth Mode: Toggles the grayscale look.
Core
Price Bins: Vertical resolution of the profile.
Lookback (Bars): Approximates your visible range.
Style
Profile Width (bars): How far the histogram extends to the right.
Bin Border Width: Outline thickness.
Markers & Lines
Show POC, Show VAH/VAL, Value Area %, VA line width.
Advanced
Distribute Volume Across Hi–Lo: More accurate, heavier compute.
Buy/Sell Split Method: Body Proportional (realistic) or Up/Down (simple).
Tips & best practices
Start with Body Proportional + Distribute Across ON for intraday accuracy.
If the chart lags, reduce Price Bins or Bars Back, or switch off distribution.
For small windows, fewer bins often looks cleaner (e.g., 30–60).
Stealth Mode plays nicely with both dark and light chart themes.
Limitations & notes
Viewport: Pine can’t access the actual visible bars; Bars Back is a practical stand-in.
Buy/Sell split: This is an approximation from candle bodies, not true bid/ask delta.
Designed for overlay; profile renders to the right of the latest bar.

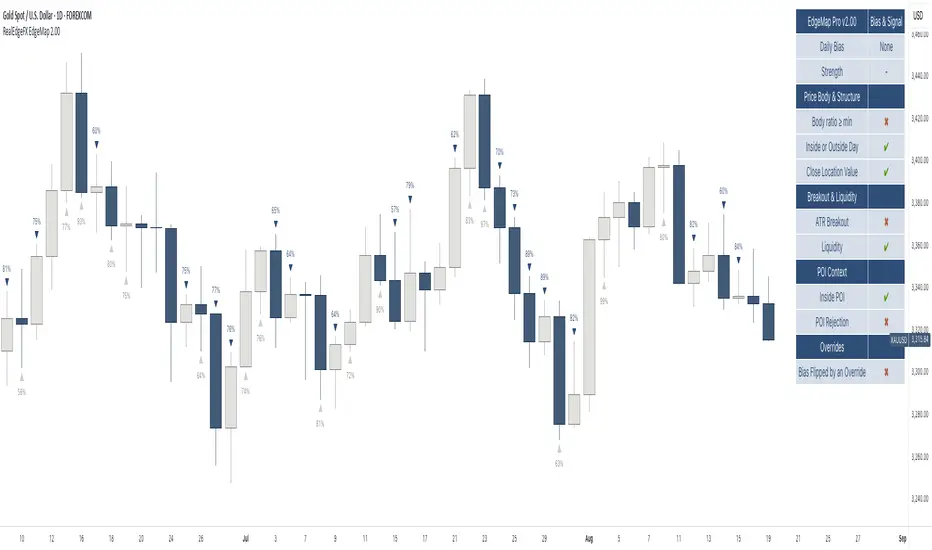
RealEdgeFX EdgeMap ProPresentation
RealEdgeFX EdgeMap Pro is built for systematic intraday decision-making. It combines a rule-based Daily Bias engine with an intraday (1-hour) regime engine based on medium timeframe engulfing (a structure change where a new directional run overwhelms the prior one). The study continuously evaluates candlestick behavior, session-level displacement, previous-day range interaction, and clearly defined points of interest (price areas left by sharp moves that often act as magnets or rejection zones). Intraday highs/lows inside an active regime are updated in real time on lower timeframes, so levels expand tick-by-tick when price makes new extremes.
Description
RealEdgeFX EdgeMap Pro is built on the idea that price alternates between contraction and expansion. Expansion begins when price drives in one direction with conviction. The study blends higher-timeframe daily context with a confirmed 1-hour structure shift called ME (Medium timeframe engulfing)—the moment a fresh run closes beyond the opening level that began the previous opposite run. From that confirmation forward, the active range’s high and low are maintained in real time on lower timeframes, expanding tick-by-tick whenever price prints new extremes. The tool also marks points of interest derived from zones where the price usually reacts following the 1h order flow context. Only the most relevant, side-aligned area is shown, and it is removed as soon as price trades decisively through it.
The engine outputs a Buy/Sell/Neutral stance and a 0–100 strength score. The definitive rules are the ones displayed in the on-chart table: the bias is produced when at least three of those criteria are active, or when a rule-based override flips the stance. Strength is calculated from the same table and increases with the number and intensity of active checks.
Tools
- Daily Bias & Strength (table-driven): Produces a Buy/Sell/Neutral bias and a 0–100 strength score for the day. The decision follows the rules shown in the on-chart table; the bias is set when at least three table criteria are active, or when a rule-based override flips it. Strength scales with how many checks are active and how strong they are.
- Medium-Timeframe Engulfing (ME) on 1-Hour: Detects a confirmed 1-hour structure shift when a new move closes beyond the opening price that started the prior opposite move. From that moment, the active range’s high/low is maintained in real time on lower timeframes, expanding tick-by-tick as new extremes print. A 1-hour close through the invalidation clears the ME and its dependents.
- Points of Interest (POI): Marks areas created by a distinct three-candle move on the 1-hour chart where the middle bar’s range does not overlap the bar from two candles earlier, or the initial candle that produces the Medium-Timeframe Engulfing. Only POIs formed after the current ME begins and lying inside the active ME range are eligible. Overlapping same-side areas merge; only the nearest, side-aligned POI is shown and it is removed once price trades decisively through it.
- ME-Based Fibonacci Levels: Draws three live reference lines tied to the active ME range—100% at the active extreme, 50% at the midpoint, and 0% at the opposite extreme. These levels extend forward, update in real time as the ME range grows, and hide automatically when no valid ME is active.
- Intraday Visuals: On the first bar of each new trading day (on intraday charts), prints an up/down arrow reflecting the current Daily Bias and a clean text label with its strength. Sizes and colors are configurable to keep the chart readable.
- On-Chart Diagnostic Table: Displays the exact rules used to build the Daily Bias and Strength, broken down by sections (Price Body & Structure, Breakout & Liquidity, POI Context, Overrides). A check mark means the criterion is currently contributing; this table is the single source of truth for the engine’s decisions.
What can you customize?
- ME Level & Label (Medium-Timeframe Engulfing): Choose line style (solid, dashed, dotted), line width, and separate colors for bullish and bearish levels. Set the label text (e.g., “ME”), its color, and size. Control how far the line/label project forward in time. Once a 1-hour close invalidates the setup, the ME line and label are removed automatically, keeping the view clean.
- POI Areas (Points of Interest): Toggle on/off. Pick separate fill colors for bullish/bearish areas, adjust transparency, and set border color, width, and style. Define how far each area extends forward. Only the most relevant, side-aligned area is shown; when price closes decisively through it, the box is cleared to avoid clutter.
- ME-Based Fibonacci Levels (100/50/0): Toggle the three reference lines, and customize each level’s color, width, and style. Turn labels on/off and set label text size and color. Control forward extension so levels project the way you prefer. Levels auto-update in real time as the ME range expands and hide when no valid ME is active.
- Intraday Day-Change Arrows & Strength Labels: Select arrow size (Tiny, Small, Normal, Large) and separate colors for buy/sell arrows. Choose text color and size for the strength percentage, also separated for buy/sell. Control the history window (how many past days’ arrows/labels remain visible) to keep the chart minimal or more informative.
- Diagnostics Table (Daily Bias & Strength): Toggle the table on/off and place it in any corner (top/bottom, left/right). Customize header background/text colors, row background/text colors, and the colors used for Buy/Sell/Neutral states. Set border width and overall text size to match your chart theme.
- Forward Extensions & History Windows: Independently control how far ME lines, POI boxes, and ME-Fibonacci levels extend into the future, and how much intraday arrow/label history is kept. These controls let you balance context vs. cleanliness on any timeframe.
How to use properly
- Add RealEdgeFX EdgeMap Pro to any TradingView symbol and timeframe.
- For execution, use intraday charts (e.g., 1–15 minutes).
- The study pulls its higher-timeframe context from the Daily and confirms structure on the 1-hour engine.
Originality & value
This study is not a mashup; it integrates a daily rule engine with a 1-hour regime detector that maintains live extremes on lower timeframes and a single, side-aligned point-of-interest filter with merging/invalidations. The combination produces a table-audited bias and strength built from measurable, configurable checks rather than generic overlays.
Terms and Conditions
Purpose and no advice. These charting tools are provided for informational and educational purposes only. They do not predict markets or provide financial, investment, or trading advice. Past performance is not indicative of future results.
User responsibility and liability. By using these tools, you agree that all decisions and outcomes are your sole responsibility. RealEdgeFX EdgeMap Pro and its creator(s) are not liable for any losses or consequences arising from the use of these products. You agree to indemnify and hold RealEdgeFX EdgeMap Pro harmless from any claims related to your use.
Access and use. Access may be granted via TradingView invite and requires an active subscription. Access is personal and non-transferable. Sharing, reselling, redistributing, copying, decompiling, or attempting to reverse engineer the code is prohibited. Access may be suspended or revoked for violations of these terms or platform policies.
Subscriptions, discounts, and cancellation. If you receive access through a Friends & Family program or use a discount code, the discount applies only to the first purchase or first billing cycle unless explicitly stated otherwise. You are solely responsible for canceling—or requesting cancellation of—your subscription if you do not wish to continue after the discounted period and/or at full price.
Refund policy. No reimbursements, refunds, or chargebacks are provided, to the maximum extent permitted by law.
Acceptance and updates. By continuing to use these tools, you acknowledge and agree to these Terms and Conditions. RealEdgeFX EdgeMap Pro may update these terms from time to time; continued use after updates constitutes acceptance of the revised terms.
JL - Market HeatmapThis indicator plots a static table on your chart that displays any tickers you want and their % change on the day so far.
It updates in real time, changes color as it updates, and has several custom functions available for you:
1. Plot up to 12 tickers of your choice
2. Choose a layout with 1-4 rows
3. Display % Change or Not
4. Choose your font size (Tiny, Small, Normal, Large)
5. Up/Down Cell Colors (% change dependent)
6. Up/Down Text Colors (high contrast to your color choices)
The purpose of the indicator is to quickly measure a broad basket of market instruments to paint a more context-rich perspective of the chart you are looking at.
I hope this indicator can help you (and me) accomplish this task in a simple, clean, and seamless manner.
Thanks and enjoy - Jack

NYSE Advancing Issues & Volume RatiosOverview
This comprehensive market breadth indicator tracks two essential NYSE ratios that provide deep insights into market sentiment and internal strength:
NYSE Advancing Issues Ratio
NYSE Advancing Volume Ratio
Dual Ratio Analysis
Issues Ratio: Measures the percentage of NYSE stocks advancing vs. total issues
Volume Ratio: Measures the percentage of NYSE volume flowing into advancing stocks
Both ratios displayed as easy-to-read percentages (0-100%)
Customizable Display Options
Toggle each ratio on/off independently
Choose from multiple moving average types (SMA, EMA, WMA)
Adjustable moving average periods
Custom color schemes for better visualization
Reference Levels
50% Line: Market neutral point (gray dashed)
10% Line: Extremely bearish breadth (red dotted)
90% Line: Extremely bullish breadth (green dotted)
Optional background highlighting for extreme readings
Smart Alerts
Cross above/below 50% (neutral) for both ratios
Extreme readings: Above 90% (strong bullish) and below 10% (strong bearish)
Real-time notifications for key market breadth shifts
📈 How to Interpret
Bullish Signals
Above 50%: More stocks/volume advancing than declining
Above 90%: Extremely strong market breadth (rare occurrence)
Divergence: Price making new highs while breadth weakens (potential warning)
Market Timing
Extreme readings (10%/90%) often coincide with market turning points
Breadth thrusts from extreme levels can signal powerful moves
Use with other technical indicators for enhanced timing

MK_OSFT-Multi-Timeframe MA Dashboard & Smart Alerts-v2📊 Multi-Timeframe MA Dashboard & Smart Alerts v2.0
Transform your trading with the ultimate moving average monitoring system that tracks up to 8 different MA configurations across multiple timeframes simultaneously.
🎯 What This Indicator Does
This advanced dashboard eliminates the need to constantly switch between timeframes by displaying all your critical moving averages on a single chart. Whether you're scalping on 5-minute charts or swing trading on daily timeframes, you'll instantly see the big picture.
⭐ Key Features
📈 Multi-Timeframe Moving Averages
Monitor up to **8 different MA configurations** simultaneously
Support for **SMA and EMA** across 6 timeframes (5m, 15m, 1h, 4h, Daily, Weekly)
Each MA fully customizable: length, color, alert settings, and visibility
Smart visual representation with labeled horizontal lines and connecting plots
🚨 Intelligent Alert System
Cross-over/Cross-under alerts for price vs MA interactions
Three alert modes : No alerts, Once only, or Once per bar close
Smart batching system prevents alert spam during volatile periods
Queue management with 3-second delays between alerts for optimal performance
Easy alert reset functionality for "once only" alerts
📊 Real-Time Information Dashboard
Live countdown timers showing time remaining until each timeframe closes
Color-coded progress bars with gradient visualization (green → yellow → orange → red)
Instant cross-over detection with up/down arrow indicators
Price vs MA relationship clearly displayed (above/below coloring)
🎨 Professional Visualization
Anti-overlap technology prevents labels from clustering
Customizable label positioning and sizing options
Drawing order control (larger timeframes first/last)
Connecting lines link current price to MA values
Status line integration for quick value reference
💡 Perfect For
Multi-timeframe traders [/b who need complete market context
Trend followers monitoring key MA levels across timeframes
Breakout traders waiting for price to cross critical moving averages
Risk managers using MAs as dynamic support/resistance levels
Anyone wanting organized, clutter-free MA monitoring
⚙️ Highly Configurable
Moving Average Settings
Individual enable/disable for each of 8 MA slots
Flexible timeframe selection : 5m, 15m, 1h, 4h, Daily, Weekly
MA type choice : SMA or EMA for each configuration
Custom lengths from 1 to any desired period
Color customization for each MA line and label
Alert Management
Per-MA alert configuration : Choose which MAs trigger alerts
Source selection : Current bar vs last confirmed bar calculations
Frequency control : Prevent over-alerting with smart queuing
Reset functionality : Easily reactivate "fired" once-only alerts
Display Options
Table positioning : Top-right, bottom-left, or bottom-right
Label styling : Size, offset, and gap control
Line customization : Width and extension options
Timezone adjustment : Align timestamps with your local time
🔧 Technical Excellence
Optimized performance with efficient array management and single-pass calculations
Real-time vs historical mode handling for accurate backtesting
Memory-efficient label and line management prevents accumulation
Robust error handling and edge case management
Clean, well-documented code following Pine Script best practices
📋 How to Use
Add to chart and configure your desired MA combinations
Set alert preferences for each MA (none/once/per bar)
Create TradingView alert using "Any alert() function calls"
Monitor the dashboard for cross-over signals and timeframe progress
Use the info table to track all MA values and alert statuses at a glance
🎓 Educational Value
This indicator serves as an excellent educational tool for understanding:
Multi-timeframe analysis principles
Moving average confluence and divergence
Alert system design and management
Professional indicator development techniques
---
Transform your trading workflow with this professional-grade multi-timeframe MA monitoring system. No more chart hopping - get the complete moving average picture in one powerful dashboard!
© MK_OSF_TRADING | Pine Script v6 | Mozilla Public License 2.0

BOS & CHoCH (v6, UA)The logic of the trading strategy
This is a well-structured and concise summary of a trading strategy based on market structure analysis. Here is the English translation.
Swings
ta.pivothigh/low on a selected structure timeframe (TF). When a swing is confirmed, we fix the level and the bar_index of the current chart as an anchor for a horizontal line.
BOS (Break of Structure)
A breakout of the last Swing High (SH) or Swing Low (SL) in the direction of the current trend.
CHoCH (Change of Character)
A breakout against the trend, signaling a potential trend reversal.
Breakout
By close or by high/low (you can switch the breakout confirmation mode to closing price).

Institutional Interest DisplayIndicator Overview:
This dashboard helps evaluate stocks quickly based on Market Cap, 52-week positioning, and liquidity metrics. It combines price strength with volume demand signals for breakout or institutional interest.
Logic Implemented:
1. Market Cap Classification:
- Market Cap = close × shares_outstanding (built-in value if available)
- Large-cap: ≥ ₹20,000 Cr
- Mid-cap: ₹5,000 – 20,000 Cr
- Small-cap: < ₹5,000 Cr
2. 52-Week Range (% from High/Low):
- 52W High = ta.highest(high, 252)
- 52W Low = ta.lowest(low, 252)
- % from 52W High = (Close ÷ 52W High – 1) × 100
- % from 52W Low = (Close ÷ 52W Low – 1) × 100
- CANSLIM logic → Prefer stocks near highs, avoid near lows
3. Average Daily Volume (ADV):
- ADV = ta.sma(volume, 50)
- Chosen 50D (more reliable than 20/30D, smooths anomalies)
4. Breakout Volume Confirmation:
- Volume Signal = Current Volume ÷ ADV
- Breakout Threshold = >1.5 × ADV
- Helps detect demand-driven price breakouts
5. % Change in Volume vs ADV:
- %Chg = ((Current Vol ÷ ADV) – 1) × 100
- Indicates abnormal activity vs typical trading
6. Up/Down Volume Ratio (U/D Ratio):
- Defined as: (Sum of volume on up days ÷ Sum of volume on down days)
- 50-day window
- U/D > 1 = net buying pressure
- U/D > 1.2 = stronger institutional demand
7. Up Days with Volume ≥ 1.5 × ADV:
- Counts number of up days (Close > Previous Close) in last 50 days where Volume ≥ 1.5 × ADV
8. Average Turnover:
- AvgTurnover = Avg Volume × Price
- Thresholds:
- Large-cap ≥ 1000M
- Mid-cap ≥ 200M
- Small-cap ≥ 50M
Table Layout:
- 4 Columns:
- Col 1 → Category, Market Cap, % from 52W Low, % from 52W High
- Col 2 → Values for above
- Col 3 → Avg Volume, Vol Today, %Chg Vol, U/D Ratio
- Col 4 → Values for above + Up Days >1.5 × ADV, Avg Turnover
Color Coding:
- Value cells have distinct background colors
- Labels = black text, grey background
- Green highlights signify thresholds met

MTF Target Prediction LiteMTF Target Prediction Enhanced Lite
Description:
MTF Target Prediction Enhanced is an advanced multi-timeframe technical analysis indicator that identifies and clusters target price levels based on trendline breakouts across multiple timeframes. The indicator uses sophisticated clustering algorithms to group similar price targets and provides visual feedback through dynamic arrows, cluster boxes, and detailed statistics.
Key Features:
Multi-Timeframe Analysis: Simultaneously analyzes up to 8 different timeframes to identify convergence zones
Smart Clustering: Groups nearby target prices into clusters with quality scoring
Predictive Arrows: Dynamic arrows that track price movement toward cluster targets
Grace Period System: Prevents false cluster loss signals with configurable waiting period
Enhanced Quality Scoring: 5-component quality assessment (Density, Consistency, Reachability, Size, Momentum)
Real-time Statistics: Track performance with win rate, P&L, and success metrics
Adaptive Performance Modes: Optimize for speed or accuracy based on your needs
How It Works:
The indicator identifies pivot points and trendlines on each selected timeframe
When a trendline breakout occurs, it calculates a target price based on the measured move
Multiple targets from different timeframes are grouped into clusters when they converge
Each cluster receives a quality score based on multiple factors
High-quality clusters generate prediction arrows showing potential price targets
The system tracks whether targets are reached or clusters are lost
Settings Guide:
⚡ Performance
Performance Mode: Choose between Fast (200 bars), Balanced (500 bars), Full (1000 bars), or Unlimited processing
🎯 Clustering
Max Cluster Distance (%): Maximum price difference to group targets (default: 1.5%)
Min Cluster Size: Minimum number of targets to form a cluster (default: 2)
One Direction per TF: Allow only one direction signal per timeframe
Cluster Grace Period: Bars to wait before considering cluster lost (default: 10)
➡️ Prediction Arrows
Min Quality for Arrow: Minimum cluster quality to create arrow (0.1-1.0)
Quality Weights: Adjust importance of each quality component
Close Previous Arrows: Auto-close arrows when new ones appear
Use Trend Filter: Create arrows only in trend direction
Trend Filter Intensity: Sensitivity of trend detection (High/Medium/Low)
📅 Timeframes
Pivot Length: Bars for pivot calculation (default: 3)
Timeframes 1-8: Select up to 8 timeframes for analysis
Visualize
Show Cluster Analysis: Display cluster boxes and labels
Show Cluster Boxes: Rectangle visualization around clusters
Show TP Lines: Display individual target price lines
Show Trend Filter: Visualize trend cloud
Show Prediction Arrows: Display directional arrows to targets
Show Statistics Table: Performance metrics display
Visual Elements:
Green/Red Boxes: Cluster zones with transparency based on quality
Arrows: Diagonal lines pointing to cluster targets
Green/Red: Active and tracking
Orange: In grace period
Gray: Cluster lost
Labels: Detailed cluster information including:
Timeframes involved
Center price (C)
Quality score (Q)
Component scores (D,C,R,S,M)
Distance from current price
Result Markers:
✓ Green: Target reached successfully
✗ Red/Gray: Cluster lost
Quality Components Explained:
D (Density): How tightly packed the TPs are relative to ATR
C (Consistency): How close the timeframes are to each other
R (Reachability): Likelihood of reaching target based on distance and trend
S (Size): Number of TPs in cluster (with diminishing returns)
M (Momentum): Alignment with current price momentum
Best Practices:
Start with Balanced performance mode and default settings
Use higher timeframes (D, W) for more reliable clusters
Look for clusters with quality scores above 0.7
Enable trend filter to reduce false signals
Adjust grace period based on your timeframe (higher TF = longer grace)
Monitor the statistics table to track indicator performance
Alerts Available:
High-quality cluster formation (UP/DOWN)
Target reached notifications
Cluster lost warnings
------------------------------------------------------------------------------------------------------------------
MTF Target Prediction Enhanced Lite
Описание:
MTF Target Prediction Enhanced - это продвинутый мультитаймфреймовый индикатор технического анализа, который идентифицирует и кластеризует целевые уровни цен на основе пробоев трендовых линий на нескольких таймфреймах. Индикатор использует сложные алгоритмы кластеризации для группировки схожих ценовых целей и предоставляет визуальную обратную связь через динамические стрелки, кластерные боксы и детальную статистику.
Ключевые особенности:
Мультитаймфреймовый анализ: Одновременный анализ до 8 различных таймфреймов для определения зон схождения
Умная кластеризация: Группировка близких целевых цен в кластеры с оценкой качества
Прогнозные стрелки: Динамические стрелки, отслеживающие движение цены к целям кластера
Система Grace Period: Предотвращение ложных сигналов потери кластера с настраиваемым периодом ожидания
Улучшенная оценка качества: 5-компонентная оценка (Плотность, Согласованность, Достижимость, Размер, Импульс)
Статистика в реальном времени: Отслеживание эффективности с винрейтом, P&L и метриками успеха
Адаптивные режимы производительности: Оптимизация скорости или точности по вашим потребностям
Как это работает:
Индикатор определяет опорные точки и трендовые линии на каждом выбранном таймфрейме
При пробое трендовой линии рассчитывается целевая цена на основе измеренного движения
Множественные цели с разных таймфреймов группируются в кластеры при схождении
Каждый кластер получает оценку качества на основе нескольких факторов
Высококачественные кластеры генерируют стрелки прогноза, показывающие потенциальные цели
Система отслеживает достижение целей или потерю кластеров
Руководство по настройкам:
⚡ Производительность
Performance Mode: Выбор между Fast (200 баров), Balanced (500), Full (1000) или Unlimited
🎯 Кластеризация
Max Cluster Distance (%): Максимальная разница цен для группировки (по умолчанию: 1.5%)
Min Cluster Size: Минимальное количество целей для формирования кластера (по умолчанию: 2)
One Direction per TF: Разрешить только один сигнал направления на таймфрейм
Cluster Grace Period: Бары ожидания перед потерей кластера (по умолчанию: 10)
➡️ Стрелки прогноза
Min Quality for Arrow: Минимальное качество кластера для создания стрелки (0.1-1.0)
Quality Weights: Настройка важности каждого компонента качества
Close Previous Arrows: Автозакрытие стрелок при появлении новых
Use Trend Filter: Создавать стрелки только в направлении тренда
Trend Filter Intensity: Чувствительность определения тренда (Высокая/Средняя/Низкая)
📅 Таймфреймы
Pivot Length: Бары для расчета пивота (по умолчанию: 3)
Timeframes 1-8: Выбор до 8 таймфреймов для анализа
Визуализация
Show Cluster Analysis: Отображение боксов и меток кластеров
Show Cluster Boxes: Визуализация прямоугольников вокруг кластеров
Show TP Lines: Отображение линий целевых цен
Show Trend Filter: Визуализация облака тренда
Show Prediction Arrows: Отображение направленных стрелок к целям
Show Statistics Table: Отображение метрик эффективности
Визуальные элементы:
Зеленые/Красные боксы: Зоны кластеров с прозрачностью на основе качества
Стрелки: Диагональные линии, указывающие на цели кластера
Зеленые/Красные: Активные и отслеживающие
Оранжевые: В периоде ожидания
Серые: Кластер потерян
Метки: Детальная информация о кластере:
Задействованные таймфреймы
Центральная цена (C)
Оценка качества (Q)
Оценки компонентов (D,C,R,S,M)
Расстояние от текущей цены
Маркеры результата:
✓ Зеленый: Цель успешно достигнута
✗ Красный/Серый: Кластер потерян
Объяснение компонентов качества:
D (Density/Плотность): Насколько плотно расположены TP относительно ATR
C (Consistency/Согласованность): Насколько близки таймфреймы друг к другу
R (Reachability/Достижимость): Вероятность достижения цели с учетом расстояния и тренда
S (Size/Размер): Количество TP в кластере (с убывающей отдачей)
M (Momentum/Импульс): Соответствие текущему импульсу цены
Лучшие практики:
Начните с режима Balanced и настроек по умолчанию
Используйте старшие таймфреймы (D, W) для более надежных кластеров
Ищите кластеры с оценкой качества выше 0.7
Включите фильтр тренда для уменьшения ложных сигналов
Настройте grace period в зависимости от вашего таймфрейма (старший TF = дольше grace)
Следите за таблицей статистики для отслеживания эффективности индикатора
Доступные алерты:
Формирование высококачественного кластера (ВВЕРХ/ВНИЗ)
Уведомления о достижении цели
Предупреждения о потере кластера
Disclaimer / Отказ от ответственности:
This indicator is for educational and informational purposes only. Past performance does not guarantee future results. Always conduct your own analysis and risk management.
Данный индикатор предназначен только для образовательных и информационных целей. Прошлые результаты не гарантируют будущих результатов. Всегда проводите собственный анализ и управление рисками.

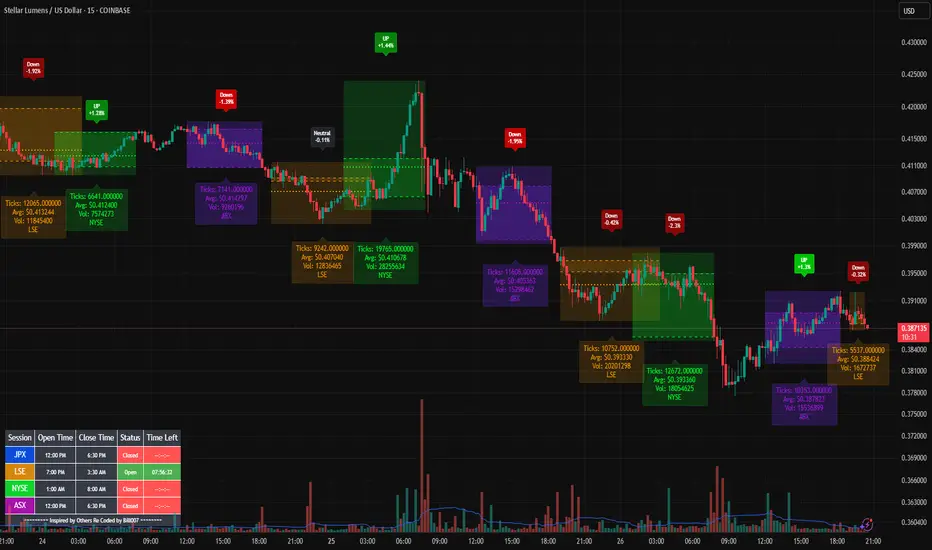
Bills Advanced Market Sessions V5Bill007 Advanced Enhanced Market Sessions & Table V5 is a TradingView Pine Script indicator that
visualizes major stock market sessions and data for (Tokyo, London, New York, Sydney, Frankfurt) on charts.
**Purpose and Logic:**
- Visual Displays include session boxes, open/close/average lines, labels for session
names/metrics (ticks, avg price, volume), and trend labels (UP/Down/Neutral with % change)
and a Debug table.
- Uses custom types (SessionDisplay, SessionInfo) and methods to create/update sessions
dynamically, handling multi-part sessions (e.g., Tokyo breaks).
- Batch updates sessions for efficiency, checks timezones, weekdays, and daily changes to avoid
duplicates.
- Includes tables for session times/status/countdowns and debug metrics (tick range, average
price, volume, trend %, open, close).
- Supports 25 timezones for accurate global session timing.
- All labels have dynamaic tooltips that provide extra outputs which saves chart clutter
- Realtime lastbar session updates for current session
**Settings:**
- Select Market Sessions to suit
- Toggles for lines, ranges, averages, volumes, labels, boxes, weekends.
- Customizable colors, timezones, session times, thresholds for neutral trends, label offsets to
move labels around for clearer visuals.
- Table position/timezone, debug options.
- Timezone select to update Session times open close according to what time zone you're in
**Benefits:**
- Enhanced session data at a glance
- Enhances multi-market awareness, highlights session overlaps, trends, and key metrics.
- Aids timing entries/exits, volume analysis, reduces clutter with toggles.
- Supports global trading strategies with accurate timezone handling and visuals.
VSA - The Volume HUDVSA Volume HUD: Your At-a-Glance Volume Dashboard
Tired of cluttered charts with multiple indicators taking up screen space?
The VSA Volume HUD is a clean, powerful, and fully customisable Heads-Up Display that puts all the critical volume and price action data you need into one compact box, right on your chart.
Designed for traders who rely on Volume Spread Analysis (VSA), this tool helps you instantly gauge the strength, conviction, and context behind every price move as it happens.
Key Features
This indicator isn't just about showing the current volume; it provides a comprehensive, real-time analysis of the market's activity.
Real-time VSA Dashboard: A persistent on-screen table that updates with every tick, giving you instant feedback without needing to look away from the price. The HUD is fully draggable (hold Ctrl/Cmd + click and drag) to place it anywhere you like.
Essential Volume Metrics:
Current Volume: Displayed in a clean, abbreviated format (e.g., 1.25M for millions, 54.3K for thousands).
% Change (vs. Previous Bar): Instantly see if volume is expanding or contracting.
Vs Short-Term Average: Compare the current bar's volume to a moving average to spot unusual spikes.
Volume Velocity: Measures the rate of change in volume over a short period, helping you spot acceleration or deceleration in market interest.
Relative Volume (RVOL): See how the current volume compares to the average for that specific time of day, perfect for identifying abnormally high or low activity.
Price Action & Volatility Context:
Range vs. ATR: Quickly determine if the current bar's volatility is expanding or contracting compared to the recent average.
Price vs. VWAP: See how far the current price has deviated from the session's Volume-Weighted Average Price, a key level for institutional traders.
Deep Customization is Key
Tailor the HUD to perfectly match your trading style and chart aesthetic.
Display & Layout:
Compact Mode: Remove the metric labels for a sleek, minimalist view that saves screen space.
Bar Meters: Enable optional visual bars next to key metrics for a quick, graphical representation of strength.
Total Control: Toggle every single metric on or off to build the exact dashboard you need. Adjust text size, position, and background opacity with ease.
Smart Coloring & Visual Alerts:
Advanced VSA Coloring: This isn't just about up/down candles. The script intelligently colors volume based on confluence. It highlights increasing volume on a strong up-bar (bullish confirmation) or increasing volume on a down-bar (potential climax or distribution), giving you a deeper VSA context.
High Volume Highlight: Make standout bars impossible to miss! The entire HUD background can change color automatically when volume surges past a custom threshold (e.g., over 150% of the average), instantly drawing your attention to critical moments.
Full Color Customization: Change every color to match your chart's theme, including separate colors for bullish/bearish moves, the background, and the border.
How to Use It
The VSA Volume HUD is a powerful confirmation tool. Use it to:
Confirm Breakouts: Look for a spike in Volume vs. Average and RVOL as price breaks a key level.
Spot Exhaustion: Notice high volume on a narrow-range candle after a long trend, visible through the Range/ATR metric.
Gauge Conviction: Use the Advanced Coloring to see if volume is supporting the price move (e.g., green volume on a green candle) or diverging from it.

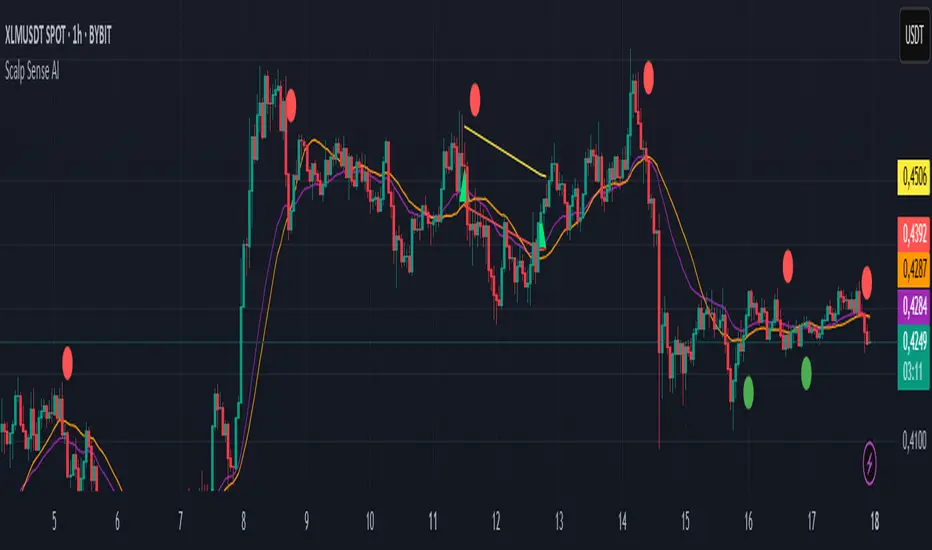
Scalp Sense AI# Scalp Sense AI (No Repaint)
**Adaptive trend & reversal detector with an AI-driven score, multi-timeframe confirmations, robust volume filters, and a purpose-built Scalping Mode.**
Signals are generated **only on bar close** (no repaint), include structured alert payloads for webhooks, and come with optional ATR-based TP/SL visualization for study and validation.
---
## What it is (in one paragraph)
**Scalp Sense AI** combines classic market structure (DI/ADX, EMA, SMA, Keltner, ATR) with a continuous **AI Score** that fuses RSI normalization, EMA distance (in ATR units), and DI edge into a single, volatility-aware signal. It adaptively gates **trend** and **reversal** entries, applies **HTF confirmation** without lookahead, and enforces **guard rails** (e.g., strong-trend reversal blocking) unless a high-confidence AI override and volume confirmation are present. **Scalping Mode** compresses reaction times and adds micro price-action cues (wick rejections, micro-EMA crosses, small engulfing) to surface more—but disciplined—opportunities.
---
## Non-Repainting Design
* All signals, markers, state, and alerts are computed **after bar close** using `barstate.isconfirmed`.
* HTF data are requested with `lookahead_off`.
* No “future-peeking” constructs are used.
* Result: signals do **not** change after the candle closes.
---
## How the engine works (pipeline overview)
1. **Base metrics**
* **RSI**, **EMA**, **ATR** (+ ATR SMA for regime/volatility), **SMA long & short**, **Keltner** (EMA ± ATR×mult).
* **Manual DI/ADX** for fine control (DM+, DM−, true range smoothing).
2. **Volatility regime**
* Compares ATR to its SMA and scales thresholds by √(ATR/ATR\_SMA) → robust “high\_vol” gating.
3. **Volume & flow**
* **Volume Z-score**, **OBV slope**, and **MFI** (all computed manually) to confirm impulses and filter weak reversals.
4. **Higher-Timeframe confirmation (optional)**
* Imports HTF **PDI/MDI/ADX** and **SMA** (no lookahead) to require alignment when enabled.
5. **AI Score**
* Weighted fusion of **RSI (normalized around 0)**, **EMA distance (in ATR)**, and **DI edge**.
* Smoothed; then its **mean (μ)** and **volatility (σ)** are estimated to form **adaptive bands** (hi/lo), with optional **hysteresis**.
* **Debounce** (M in N bars) avoids flicker; **bias state** persists until truly invalidated.
6. **Signal logic**
* **Trend entries** require AI bias + trend confirmations (DI/ADX/SMA, HTF if enabled), volatility OK, and **anti-breakout** filter.
* **Reversal entries** come in **core**, **early**, and **scalp** flavors (progressively more frequent), guarded by strong-trend blocks that an **AI+volume+ADX-cooling override** can bypass.
7. **Scalping Mode**
* Adaptive parameter contraction (shorter lengths), gentler guards, micro-patterns (wick/engulf/micro-EMA cross), and reduced cooldown to increase high-quality opportunities.
8. **Cooldown & state**
* One signal per side after a configurable spacing in bars; internal “last direction” avoids clustering.
9. **Visualization & alerts**
* **Triangles** for trend, **circles** for reversals (offset by ATR to avoid overlap).
* **Single-line alert payload** (BUY/SELL, reason, AI, volZ, ADX) ready for webhooks.
---
## Signals & visualization
* **Trend Long/Short** → triangle markers (above/below) when:
* AI bias aligns with trend confirmations (DI edge, ADX above threshold, price vs long SMA, optional HTF alignment).
* Volatility regime agrees; **anti-breakout** prevents entries exactly at lookback highs/lows.
* **Reversal Long/Short** → circular markers when:
* **Core**: AI near “loose” band, OBV/MFI/volZ supportive, ADX cooling, DI spread relaxed, PA confirms (crosses/div).
* **Early**: anticipatory patterns (Keltner exhaustion, simple RSI “quasi-divergence”).
* **Scalp**: micro-EMA cross, wick rejection, mini-engulfing, with relaxed guards but AI/volume still in the loop.
* **Markers appear only on the bar that actually emitted the signal** (no repaint); offsets use ATR so shapes don’t overlap.
---
## Alerts (ready for webhooks)
Enable “**Any alert() function call**” and you’ll receive compact, single-line payloads once per bar:
```
action=BUY;reason=reversal-early;ai=0.1375;volZ=0.82;adx=27.5
action=SELL;reason=trend;ai=-0.2210;volZ=0.43;adx=31.9
```
* `action`: BUY / SELL
* `reason`: `trend` | `reversal-core` | `reversal-early` | `reversal-scalp`
* `ai`: current smoothed AI Score at signal bar
* `volZ`: volume Z-score
* `adx`: current ADX
---
## Inputs (exhaustive)
### 1) Core Inputs
* **RSI Length (Base)** (`rsi_length_base`, int)
Base RSI lookback. Shorter = more reactive; longer = smoother.
* **RSI Overbought Threshold** (`rsi_overbought`, int)
Informational for context; RSI is used normalized in the AI fusion.
* **RSI Oversold Threshold** (`rsi_oversold`, int)
Informational; complements visual context.
* **EMA Length (Base)** (`ema_length_base`, int)
Primary adaptive mean; also used for Keltner mid and distance metric.
* **ATR Length (Base)** (`atr_length_base`, int)
Volatility unit for Keltner, SL/TP (debug), and regime detection.
* **ATR SMA Length** (`atr_sma_len`, int)
Smooth baseline for ATR regime; supports “high\_vol” logic.
* **ATR Multiplier Base** (`atr_mult_base`, float)
Scales volatility gating (sqrt-scaled); higher = tighter high-vol requirement.
* **Disable Volatility Filter** (`disable_volatility_check`, bool)
Bypass volatility gating if true.
* **Price Change Period (bars)** (`price_change_period_base`, int)
Simple momentum check (+/−% over N bars) used in trend validation.
* **Base Cooldown Bars Between Signals** (`signal_cooldown_base`, int ≥ 0)
Minimum bars to wait between signals (per side).
* **Trend Confirmation Bars** (`trend_confirm_bars`, int ≥ 1)
Require persistence above/below long SMA for this many bars.
* **Use Higher Timeframe Confirmation** (`use_higher_tf`, bool)
Turn on/off HTF alignment (no repaint).
* **Higher Timeframe for Confirmation** (`higher_tf`, timeframe)
E.g., “60” to confirm M15 with H1; used for HTF PDI/MDI/ADX and SMA.
* **TP as ATR Multiple** (`tp_atr_mult`, float)
For **visual debug** only (drawn after entries); not an order manager.
* **SL as ATR Multiple** (`sl_atr_mult`, float)
For visual debug only.
* **Enable Scalping Mode** (`scalping_mode`, bool)
Compresses lengths/thresholds, unlocks micro-PA modules, reduces cooldown.
* **Show Debug Lines** (`show_debug`, bool)
Plots AI bands, DI/ADX, EMA/SMA, Keltner, vol metrics, and TP/SL (debug).
### 2) AI Score & Thresholds
* **AI Score Smooth Len** (`ai_len`, int)
EMA smoothing over the raw fusion.
* **AI Volatility Window** (`ai_sigma_len`, int)
Window to estimate AI mean (μ) and standard deviation (σ).
* **K High (sigma)** (`ai_k_hi`, float)
Upper band width (σ multiplier) for strong threshold.
* **K Low (sigma)** (`ai_k_lo`, float)
Lower band width (σ multiplier) for loose threshold.
* **Debounce Window (bars)** (`ai_debounce_m`, int ≥ 1)
Rolling window length used by the confirm counter.
* **Min Bars>Thr in Window** (`ai_debounce_n`, int ≥ 1)
Minimum confirmations inside the debounce window to validate a state.
* **Use Hysteresis Thresholds** (`ai_hysteresis`, bool)
Requires crossing back past a looser band to exit bias → fewer whipsaws.
* **Weight DI Edge (0–1)** (`ai_weight_di`, float)
Importance of DI edge within the fusion.
* **Weight EMA Dist (0–1)** (`ai_weight_ema`, float)
Importance of EMA distance (in ATR units).
* **Weight RSI Norm (0–1)** (`ai_weight_rsi`, float)
Importance of normalized RSI.
* **Sensitivity (0–1)** (`sensitivity`, float)
Contracts/expands bands (higher = more sensitive).
### 3) Volume Filters
* **Volume MA Length** (`vol_ma_len`, int)
Baseline for volume Z-score.
* **Volume Z-Score Window** (`vol_z_len`, int)
Std-dev window for Z-score; larger = fewer volume “spikes”.
* **Reversal: Min Volume Z for confirm** (`vol_rev_min_z`, float)
Minimum Z required to validate reversals (adaptively relaxed in scalping).
* **OBV Slope Lookback** (`obv_slope_len`, int)
Rising/falling OBV over this window supports bull/bear confirmations.
* **MFI Length** (`mfi_len`, int)
Money Flow Index lookback (manual calculation).
### 4) Filters (Breakout / ADX / Reversal)
* **Enable Breakout Filter** (`enable_breakout_fil`, bool)
Avoid trend entries at lookback highs/lows.
* **Breakout Lookback Bars** (`breakout_lookback`, int ≥ 1)
Window for the anti-breakout guard.
* **Base ADX Length** (`adx_length_base`, int)
Lookback for DI/ADX smoothing (also adapted in Scalping Mode).
* **Base ADX Threshold** (`adx_threshold_base`, float)
Minimum ADX to validate trend context (scaled in Scalping Mode).
* **Enable Reversal Filter** (`enable_rev_filter`, bool)
Master switch for reversal logic.
* **Max ADX for Reversal** (`rev_adx_max`, float)
Hard cap: above this ADX, reversals are blocked (unless overridden by AI if allowed in Guards).
### 5) Reversal Guard (regime protection & overrides)
* **Strong Trend: ADX add-above Thr** (`guard_adx_add`, float)
Extra ADX above `adx_threshold` to mark “strong” trend.
* **Strong Trend: min DI spread** (`guard_spread_min`, float)
Minimum DI separation to consider a trend “dominant”.
* **Require ADX drop from window max (%)** (`guard_adx_drop_min_pct`, float 0–1)
ADX must drop at least this fraction from its window maximum to consider “cooling”.
* **Regime Window (bars)** (`guard_regime_len`, int ≥ 10)
Window over which ADX max is measured for the “cooling” check.
* **EMA Slope Lookback** (`guard_slope_len`, int ≥ 2)
EMA slope horizon used alongside Keltner for strong-trend identification.
* **Keltner Mult (ATR)** (`guard_kc_mult`, float)
Keltner width for strong trend bands and exhaustion checks.
* **HTF Reversal Block Mode** (`htf_block_mode`, string: `Off` | `On` | `AI-controlled`)
* `Off`: never block by HTF.
* `On`: block reversals whenever HTF is strong.
* `AI-controlled`: block **unless** AI+volume+ADX-cooling override criteria are met.
* **AI-controlled: allow AI override** (`ai_htf_override`, bool)
Enables the override mechanism in `AI-controlled` mode.
* **AI override multiplier (vs band\_hi)** (`ai_override_mult`, float)
Strength needed beyond the high band to count as “strong AI”.
* **AI override: min bars beyond strong thr** (`ai_override_min_bars`, int ≥ 1)
Debounce on the override itself.
### 6) Markers
* **Reversal Circle ATR Offset** (`rev_marker_offset_atr`, float ≥ 0)
Vertical offset for reversal circles; trend triangles use a separate (internal) offset.
### 7) Scalping Mode Tuning
* **Reversal aggressiveness (0–1)** (`scalp_rev_aggr`, float)
Higher = looser guards and stronger AI sensitivity.
* **Wick: body multiple (bull/bear)** (`scalp_wick_body_mult`, float)
Wick must be at least this multiple of body to count as rejection.
* **Wick: ATR multiple (min)** (`scalp_wick_atr_mult`, float)
Minimal wick length in ATR units.
* **Micro EMA factor (vs EMA base)** (`scalp_ema_fast_factor`, float 0.2–0.9)
Fast EMA length = base EMA × factor (rounded/int).
* **Relax breakout filter in scalping** (`scalp_breakout_relax`, bool)
Lets more trend entries through in scalping context.
### 8) ICT-style SMA (bases)
* **ICT SMA Long Length (Base)** (`sma_long_len_base`, int)
Long-term baseline for regime/trend.
* **ICT SMA Short1 Length (Base)** (`sma_short1_len_base`, int)
Short baseline for price-action crosses.
* **ICT SMA Short2 Length (Base)** (`sma_short2_len_base`, int)
Companion short baseline used in PA cross checks.
> **Adaptive “effective” values:** When **Scalping Mode** is ON, the script internally shortens multiple lengths (RSI/EMA/ATR/ADX/μσ windows, SMAs) and gently relaxes guards (ADX drop %, DI spread, volume Z, override thresholds), reduces cooldown/confirm bars, and optionally relaxes the breakout filter—so you get **more frequent but still curated** signals.
---
## Plots & debug (optional)
* DI+/DI−, ADX (curr + HTF), EMA, long SMA, Keltner up/down (when strong), AI Score, AI mean, AI bands (hi/lo; low plots only when hysteresis is on), Volume MA and Z-score, and ATR-based TP/SL guide (after entries).
* These are **study aids**; the indicator does not manage trades.
---
## Recommended use
* **Timeframes**:
* Scalping Mode: M1–M15.
* Standard Mode: M15–H1 (or higher).
* **Markets**: Designed for liquid FX, indices, metals, and large-cap crypto.
* **Chart type**: Standard candles recommended (Heikin-Ashi alters inputs and hence signals).
* **Alerts**: Use “Any alert() function call”. Parse the key/value payloads server-side.
---
## Good to know
* **Why some alerts don’t draw shapes retroactively**: markers are drawn **only on** the bar that emitted the signal (no repaint by design).
* **Why a reversal didn’t fire**: strong-trend guards + HTF block may have been active; check ADX, DI spread, Keltner position, EMA slope, and whether AI override criteria were met.
* **Too many / too few signals**: tune **Scalping Mode**, `signal_cooldown_base`, AI bands (`ai_k_hi/lo`, `sensitivity`), volume Z (`vol_rev_min_z`), and guards (`rev_adx_max`, `guard_*`).
---
## Disclaimer
This is an **indicator**, not a strategy or an execution system. It does not place, modify, or manage orders. Markets carry risk—validate on historical data and demo before any live decisions. No performance claims are made.
---
### Version
**Scalp Sense AI v11.5** — Adaptive AI bands with hysteresis/debounce, HTF no-lookahead confirmations, guarded reversal logic with AI override, full volume suite (Z, OBV slope, MFI), anti-breakout filter, and a dedicated Scalping Mode with micro-PA cues.
Volumes (with MA indicator)This indicator provides a comprehensive volume analysis packed with features to enhance your trading decisions:
- Volume Bars Colored by Price Action: Volume bars are colored green or red based on the relationship between current and previous closes for intuitive trend awareness.
- Moving Average on Volume: Displays dynamic moving averages of volume on daily or weekly timeframes helping gauge volume trends.
- Low Relative Volume Highlighting: Spot volume bars with the lowest relative volume for deeper insight.
- Volume Peaks and Labels: Marks highest volumes and volume spikes using customizable labels, including volume change percentages and shares counts.
- Volume Buzz Indicator: Visual indication of volume momentum with colored buzz plots.
- Volume Statistics Table: Displays average volume, average dollar volume, volume up/down ratio, and real-time volume stats in a convenient table on the chart.
- High Customizability: Multiple input options to tailor colors, sizes, labels, and data to your preferences.
Position Size & Stop Loss | QuantEdgeBPosition Size & Stop Loss | QuantEdgeB
QuantEdgeB indicator for calculating risk-based position sizing, leverage, and dynamic stop-loss levels—all in one on-chart dashboard.
🔍 What It Does
1. Position Sizing
o Takes your Portfolio Value and Risk Percentage to compute how much dollar risk you’re willing to take.
o Given an Entry Price and Stop-Loss Price, it derives the per-trade risk and thus the optimal Position Size (number of contracts/shares).
o Based on your available Margin, it calculates the implied Leverage.
2. Stop-Loss Levels
o Offers two modes:
High-Low SL — plots the highest high and lowest low over user-defined lookback windows.
Market-Structure SL — dynamically tracks the current up/down “wick” extremes using an HMA-driven regime filter and places your stop just inside the recent high/low wicks.
o Always overlays both a “Highest Band” and “Lowest Band” as steplines, plus a simple moving average for trend context.
3. Dashboard Table
o Presents all core inputs and outputs in a neat on-chart table:
Portfolio Value, Margin, Risk %, Entry, Stop Loss
Computed Position Size and Leverage
Final Long SL and Short SL levels (depending on your chosen SL type)
o Fully customizable: choose table position, text size, color theme, and transparency.
⚙️ Inputs & Settings
Portfolio Value ($) -> Total account equity.
Margin on Exchange ($) -> Available margin for this trade.
Risk Percentage (%) -> Percent of portfolio to risk per trade.
Entry Price -> Your intended entry level.
Stop Loss Price -> Your intended stop level.
Decimal Places -> Rounding precision for “Position Size.”
Below the hood, “Position Size” is simply the number of units you should buy (or sell) so that, if your stop-loss is hit, you lose exactly your pre-defined risk amount. Here’s how to translate it into a real trade—and a quick example using the script’s default settings:
🔢 What “Position Size” Means - Deep Dive
• Units: the raw number of shares, contracts, or cryptocurrency coins.
• Risk per unit = |Entry Price – Stop-Loss Price|
• Total Risk = Portfolio Value × (Risk %)
• Position Size = Total Risk ÷ Risk per unit
If you trade instruments that are fractional (e.g. BTC) you’ll buy that many coins; if it’s a futures contract, you buy that many contracts; if it’s stock, that many shares.
🧮 Hypothetical Example
1. Inputs
o Portfolio Value = $100 000
o Risk % = 1%
o Entry Price = 105 000
o Stop-Loss Price = 104 000
o Margin Available = $10 000
2. Compute Your Risk Budget
3. Total Risk = 100 000 × (1 / 100) = $1 000
4. Compute Risk Per Unit
5. Risk per Unit = |105 000 – 104 000| = $1 000 per unit
6. Compute Position Size
7. Position Size = 1 000 ÷ 1 000 = 1 unit
o If you’re trading 1 BTC contract, you buy 1 contract.
o If it were stock, you’d buy 1 share.
o If it were spot BTC, you’d buy 1 BTC.
8. Compute Implied Leverage
9. Notional Exposure = Position Size × Entry Price = 1 × 10⁵ 000 = $105 000
10. Leverage = 105 000 ÷ 10 000 ≈ 10.5×
11. Place the Trade
o Buy 1 unit at 105 000.
o Place your stop-loss at 104 000.
o If price drifts down to 104 000, you lose exactly $1 000 (1% of your $100 000 account).
📋 Putting It All Together on the Chart
When the indicator’s table shows:
1. Portfolio Value = 100'000
2. Margin = 10'000
3. Risk% = 1%
4. Entry = 105'000
5. Stop Loss = 104'000
6. Size = 1
7. Leverage = 10.5x
…that tells you in plain terms:
“With $100 000 behind me and a 1% risk threshold, buying 1 unit here—with my stop at 104 000—means I stand to lose $1 000 if I’m wrong. I’m using $10 000 of margin, so I’m at roughly 10.5× leverage.”
No more guesswork around lot sizes or margin calls—this table gives you the exact numbers you need to place that order.
🎨 Visual Output
1. Stepline Plots
o Highest Band (short-side stop) in your down-color.
o Lowest Band (long-side stop) in your up-color.
o EMA Trend Line for context.
2. Dashboard Table
o Header with the indicator name.
o First section: all your Position Size inputs & results.
o Separator line + SL-Type label.
o Final section: Long SL and Short SL values under the chosen mode.
o Color and transparency reflect your selected theme.
🧑💼 Why It’s Useful
• Risk-First Sizing: Never guess your position again—risk is dollar-accurately defined.
• Flexible Stop-Loss: Choose the simple bar-high/low bands or an adaptive “wick-insider” based on market structure.
• On-Chart Clarity: Everything you need to size, stop-loss, and monitor your trade sits in one unified panel.
• Customizable: Color themes, font sizes, SL methods, and more—tailor it to your workflow.
Use this indicator to keep your risk parameters crystal-clear, automate your position sizing, and visualize both static and dynamic stop-loss levels—all without leaving your TradingView chart.
